Overall, it can be seen that across the entire period women were the most likely group to have the necessary amount of fruit and vegetables
Have you taken your IELTS exam yet? If you remember any of the topics and questions, please reply to this email and send them to us. Many people all around the world will be grateful for this info - thank you! |
|
|
| |
You should spend about 20 minutes on this task.
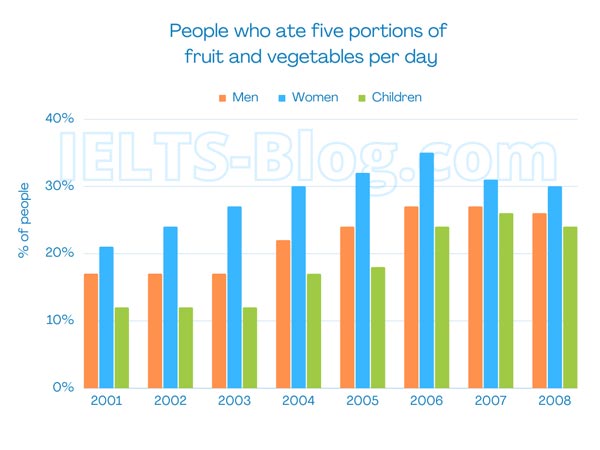
The chart below shows the percentage of people in the UK who ate at least five portions of fruit and vegetables per day between 2001 and 2008.
Summarise the information by selecting and reporting the main features, and make comparisons where relevant.
You should write at least 150 words.
| | Sample Band 8 Report The bar chart provides information on the percentage of men, women, and children that ate at least five portions of fruit and vegetables per day from 2001 to 2008.
Overall, it can be seen that across the entire period women were the most likely group to have the necessary amount of fruit and vegetables in their diet, and children - the least. Still, by the end of the period the popularity of fruit and vegetables increased among all the participants in the survey.
A closer look at the chart reveals that women had the highest percentage overall, starting at 21% in 2001 and reaching a high of 35% in 2006 after a steady rise in the previous years. By 2008, the figure had declined slightly to 30%.
The ratio of men who had 5 portions of fruit and vegetables a day was lower than that of women throughout the period. It remained steady at 17% for the first three years, from 2001 to 2003, but then rose to 27% by 2006 and declined slightly to 26% by 2008.
Children, whose figures were below those of men and women, started relatively low at 12% in 2001. The figure remained the same until 2003, and thereafter there was a noticeable increase to 17% in 2004. From then on, the figures continued to rise until they reached a high of 26% in 2007 before falling back slightly to 24% in 2008.
|
|
|
Describing a bar chart with 3 different categories can be a bit tricky. Here are a few tips:
Look at how this report ⬆️ is structured: it has 5 paragraphs. Did you know that each paragraph has its own job?
The intro tells the reader what chart your report is describing. The overview highlights the main trends without going into detail. Did you notice how the body paragraphs group the data, and compare or contrast it when appropriate? Do that in YOUR report and get a higher score!
To check your own writing submit it for correction, get feedback from our IELTS Experts and learn how to raise your score. |
|
|
"Personally, I can say that your book was so fundamental to my preparation that without it I think I would barely receive a 6.5." - Leonardo from Brazil
Learn more | |
|
|
General Training IELTS Book
"There's a reason why this book is a best-seller! I had one month to prepare and I wanted straightforward, guaranteed tips to achieve the results I need. I ended up scoring a 9 overall." - Rayan from Canada
Learn more | |
|
|
"As it turned out, the test was in exactly the same format as your examples. I would not have been able to achieve my 8 overall score on my own" - Martin from Germany
Learn more | |
|
|
IELTS Online Prep Platform *Desktop / Laptop (not for mobile)
"These practice tests are in the same format and at the same difficulty level as the real test. The tests are not only useful for preparing for the exam, but also for developing all the skills of reading, writing, listening and speaking." - Mironi from Japan
Start Free Trial | |
|
|
Download IELTS-Blog App for Practice |
|
|
| Connect with us - we're easy to find | | |
|
|
Powered by:  |


Tiada ulasan:
Catat Ulasan
Nota: Hanya ahli blog ini sahaja yang boleh mencatat ulasan.