verall, it is evident that the proportion of Adult fiction book sales increased over the years, while the sales of Biography books exhibited a
Have you taken your IELTS exam yet? If you remember any of the topics and questions, please reply to this email and send them to us. Many people all around the world will be grateful for this info - thank you! |
|
|
| |
You should spend about 20 minutes on this task.
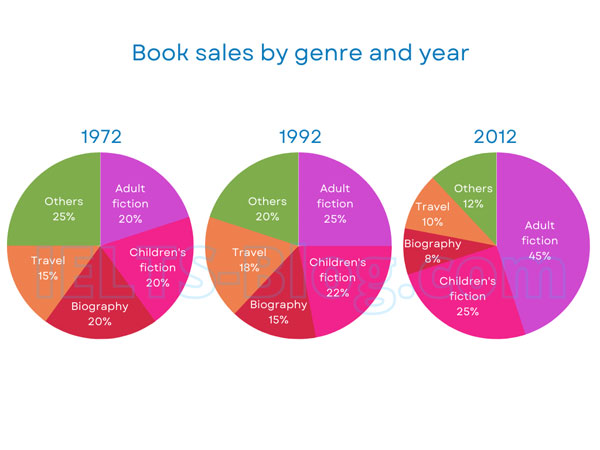
The chart below illustrates the percentages of sales of one bookseller in 1970, 1997 and 2012.
Summarise the information by selecting and reporting the main features, and make comparisons where relevant.
You should write at least 150 words.
| | Sample Band 8 Report The pie charts illustrate the sales percentages of books across five genres sold by a bookseller from 1972 to 2012.
Overall, it is evident that the proportion of Adult fiction book sales increased over the years, while the sales of Biography books exhibited a declining trend.
Initially, in 1972, the 'Other' books category dominated the market, comprising approximately 25% of total sales. In contrast, Adult fiction, Children's fiction, and Biography books each represented 20% of total sales. Travel books constituted a smaller segment at 15%. By 1992, Adult fiction had taken the lead in sales at 25%, while Children's fiction and the 'Other' category each accounted for around 20% of total sales. In the same year, Travel and Biography books made up 18% and 15% of sales, respectively.
By 2012, Adult fiction books constituted 45% of book sales. Additionally, Children's fiction represented 25% of the market. Both Travel and 'Other' book categories saw a decrease, each accounting for about 10% of total sales. In contrast, Biographies had the smallest share of sales at just 8%.
|
|
|
Describing 3 pie charts with 5 different categories can be a bit tricky. Here are a few tips:
Look at how this report ⬆️ is structured: it has 4 paragraphs. Did you know that each paragraph has its own job?
The intro tells the reader what chart your report is describing. The overview highlights the main trends without going into detail. Did you notice how the body paragraphs group the data, and compare or contrast it when appropriate? Do that in YOUR report and get a higher score!
To check your own writing submit it for correction, get feedback from our IELTS Experts and learn how to raise your score. |
|
|
"Personally, I can say that your book was so fundamental to my preparation that without it I think I would barely receive a 6.5." - Leonardo from Brazil
Learn more | |
|
|
General Training IELTS Book
"There's a reason why this book is a best-seller! I had one month to prepare and I wanted straightforward, guaranteed tips to achieve the results I need. I ended up scoring a 9 overall." - Rayan from Canada
Learn more | |
|
|
"As it turned out, the test was in exactly the same format as your examples. I would not have been able to achieve my 8 overall score on my own" - Martin from Germany
Learn more | |
|
|
IELTS Online Prep Platform *Desktop / Laptop (not for mobile)
"These practice tests are in the same format and at the same difficulty level as the real test. The tests are not only useful for preparing for the exam, but also for developing all the skills of reading, writing, listening and speaking." - Mironi from Japan
Start Free Trial | |
|
|
Download IELTS-Blog App for Practice |
|
|
| Connect with us - we're easy to find | | |
|
|
Powered by:  |


Tiada ulasan:
Catat Ulasan
Nota: Hanya ahli blog ini sahaja yang boleh mencatat ulasan.